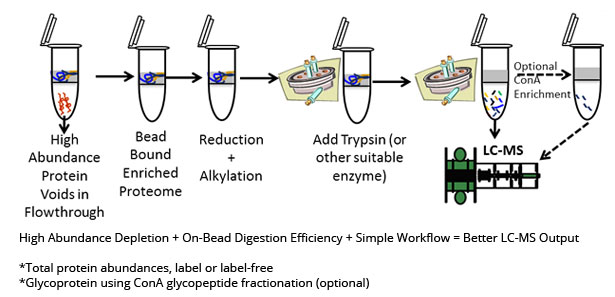
Serum and plasma proteomics can be challenging for two reasons: 1) Albumin accounts for about 50% of the total protein mass, and 2) Serum and plasma as a whole presents a challenging proteolytic sample type. For the first challenge, the AlbuVoid™ bead and associated method can efficiently deplete albumin by a voidance strategy, enriching the remaining low abundance proteins on the bead. The second challenge - proteolytic resistance, is due in part by the substantial presence of glycoproteins, a particularly resistant class of proteins. To overcome these challenges at once, we developed an optimized workflow of albumin depletion, low abundance enrichment, and on-bead digestions. Both label and label-free identifications and quantifications can be applied. With label free analysis, between 400-500 proteins can be identified depending upon the number of digests, and optional glycopeptide enrichment, see below for more details.
"We continue to collaborate with Biotech Support Group as their sample prep methods have demonstrated improvements in LC-MS workflows. This provides us with cost-effective data output, and unique proteolytic efficiencies."- Haiyan Zheng, Ph.D.,
Director Rutgers Center for Proteomics
The client supplies:
typically 50-100 µl of serum for each analysis.
Our service includes:
Sample preparation – AlbuVoid™ method to remove Albumin and Transferrin, and enrich the low abundance proteome on the bead.
On-Bead digestion – on-bead reduction, alkylation and trypsin digestion. Typically, we perform one 4 hour digestion. However, as an option, we consult with the client about the cost/benefits of performing one or more additional digest times. Additional digest times can increase the overall number of proteins identified.
On-Bead digests are exceedingly reproducible. In the graph below, we report three identical serum samples run in triplicate, with all proteins (except 3 on the overnight digest) showing negligible variance. 4 Hour digest is reported in blue; overnight (o/n) reported in orange.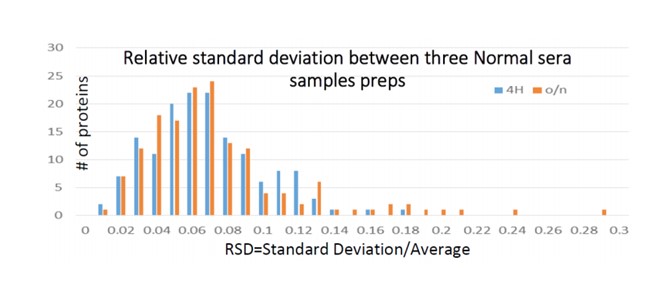 LC/MS/MS (out-sourced Rutgers Center for Innovative Proteomics) – A nanoLC-MS/MS coupling a RSLC system (Dionex, Sunnyvale CA) interfaced with a LTQ Orbitrap Velos (ThermoFisher, San Jose, CA) with resolution of 60,000 FWHM. A single 3 hour gradient is used unless otherwise specified.
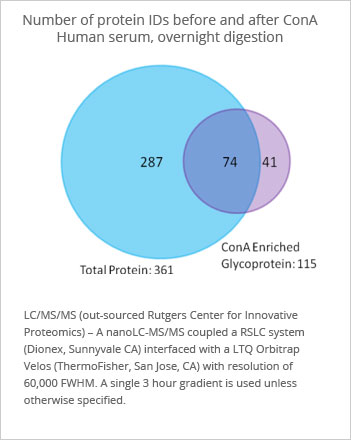
Option Isobaric Quantitative Labeling
Isobaric tags for relative and absolute quantitation (iTRAQ, TMT) is a labeling method for tandem mass spectrometry to analyze protein amounts from multiple pooled samples at once. After Trypsin digestion, the reporter groups split from the peptide and generate small fragments unique and correspondent to the original sample. The intensity of each of these reporting peaks represents the relative quantity of a peptide. Peaks in the MS2 spectrum are then used to identify peptide sequences and by inference, the protein sequences from which they were derived. By comparing the amounts of peptides labeled with each reporter, quantitative differences from all proteins identified can be readily measured and differentially assessed. While labeled samples produce less total number of proteins than without labeling, over 200 total proteins can be quantified at once from between 2 and 10 serum samples.
AlbuVoid™ LC-MS On-Bead methods produceactionable data.
Sample data from normal/healthy males ages20-40, shows little variation in isobaric label quantitative analysis, takinginto account combined technical and biological variance. N1-N5 are individualsera, N Pool is the same 5 individuals pooled, and used as reference level so ameasure of 1.00 defines no variance.
Option ConA Peptide Enrichment
Concanavlin A is a lectin affinity capture reagent that can bind to many carbohydrate containing peptides. As such it can be to enrich the glycopeptides fraction first, and then using a glycosidase enzyme, the carbohydrate can be cleaved, leaving the peptide suitable for LC-MS identification. The use of ConA as a secondary enrichment produces about 10% more total proteins than without ConA. It also allows for an additional structural characterization that would otherwise not be available within the total protein analysis.
Data analysis:
The data is searched against the species respective Ensembl databases using X!tandem with carbamidomethylation on cysteine as fixed modification and oxidation of methionine and deamidation on Asparagine as variable modifications using a 10 ppm precursor ion tolerance and a 0.4 Da fragment ion tolerance. Protein identifications that meet a suitable quality tolerance are compiled and reported with gene identifiers.
A Final Report – A full report including methods, data analysis and client responsive goals is prepared.
Example Quantitative Data From Cancer Sera
| Over-expressed Protein Identification [gene name] | Total Reporter Intensity Ratio Lung Cancer/Normal | Total Reporter Intensity Ratio Breast Cancer/Normal |
|---|---|---|
| Immunoglobulin kappa variable 1-17 [IGKV1-17] | 1.2 | 5.5 |
| Complement component 3 [C3] | 3.3 | 3.2 |
| Wolfram syndrome 1 (wolframin) [WFS1] | 4.2 | 3.1 |
| S100 calcium binding protein A9 [S100A9] | 2.3 | 2.4 |
| serum amyloid A1[SAA1] | 3.8 | 2.0 |
| serum amyloid A2[SAA2] | 3.8 | 2.0 |
| CD109 molecule [CD109] | 6.4 | 1.2 |
| unc-45 homolog A (C. elegans) [UNC-45A] | 3.6 | 1.1 |
| Armadillo repeat containing 5 [ARMC5] | 3.3 | 1.0 |
| coagulation factor (thrombin) [F2] | 4.3 | 1.0 |
| pro-platelen basic protein (chemokine (C-X-C motif) ligand 7) [PPBP] | 2.7 | 0.9 |